Posted on

Carbon Monoxide and Climate Change

There’s a lot of talk about rising levels of carbon dioxide these days. So let’s take a quick look at its deadly cousin.

One of the most prominent factors that no one seems to be talking about in climate change is the incredible increase of carbon monoxide (CO) and decrease of oxygen in Earth’s atmosphere in recent years.

Recent studies have found that our atmosphere has the highest amount of carbon monoxide levels in the last 800,000 years and averaging around 411 Parts per Million (ppm). Three years ago, the average levels were 208 ppm, which equates to a 68% increase in just a mere three years. This increase has been documented in the past, however it would taken over 250 years to change this much.

Before 1990, CO levels increased an average of a 0.5% or less increase per year. Since 1990 the average annual rise is 2% or higher. This means that since 1990 there has been more than a 56% increase in carbon monoxide levels.

Next time you consider burning, which is pretty much anything, please remember the carbon monoxide it produces. This can be your vehicle, a woodstove fire, or even electricity that is generated by coal, oil, or natural gas.

Alternative products are renewable technologies like wind and solar panel electric as well as hydrogen fuelled catalytic convertors that produce water as a by-product.
Posted on Leave a comment

Saving with Solar

We have to start saving with solar.

There is a need to educate society in the ways of reducing our destruction of the planet. We cannot continue to dig and pump up fossil fuels to power our society. Given the fact that we reject nearly 60 percent of the energy to produce what we use is just downright reckless.

We have to start to utilize a more wholistic approach to our energy use. For example, waste heat recovery, emissions recovery and so forth.

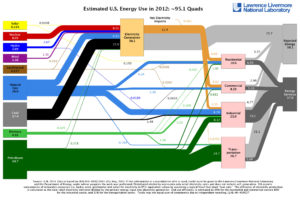
The chart below from the Lawrence Livermore National Laboratory shows how much energy is rejected in the USA. It is terrible to see how we as an advanced species to allow this much energy (aka HEAT) to be sent off into oceans, lakes and the atmosphere.

rejected energy chart

The chart clearly shows that we, based on these US figures, are not doing it correctly. Transportation and electrical generation wastes such a great deal of energy. There are obvious ways to reduce these numbers and this is what we do at Systems Solar. We look at your consumption and find ways to reduce the wasted or rejected energy in your home or business. When we consult, we can offer ways to reduce loss, reduce usage, or how to produce energy to reduce your overall costs of energy.


Remember, it is more than just a ‘log’ that you burn, it is also the energy required to feed the person who chopped the tree, it is also the fuel to move it and so forth!

Posted on Leave a comment

What is in a logo?

We released our company logo a short while ago. It is simple and succinct. Not to much flash and basic black & white. Our logo says a lot more than meets the eye.

black and white: When it comes to saving our environment there is no grey area there. We must make every effort to save our ecosystem. It also represents night and day. What we deal with in our solutions.


the circle: The circle besides its mathematical meaning can also denote unity, oneness, and completion. Additionally a circle with a dot in the centre is the astronomical symbol for the sun.


the mobius strip: The mobius strip means infinity. The sun gives us an endless supply of energy. Energy to grow, to create oxygen from photosynthesis. It is an endless supply of life-giving force. The mobius also looks like a propeller, and in doing so, it denotes our work with wind turbines as part of our solar solutions.


the lightning bolt: The lightning bolt denotes the power we harness from the sun and the energy we use. It also symbolizes strength and conviction of our organization.


Systems-Solar.com